pyvueeel package
Common functions for Python/Vue/Eel project.


It contains functions for running eel, overriding eel.expose decorator, converting json to correct python format or transform data into form for vue tables and plots.
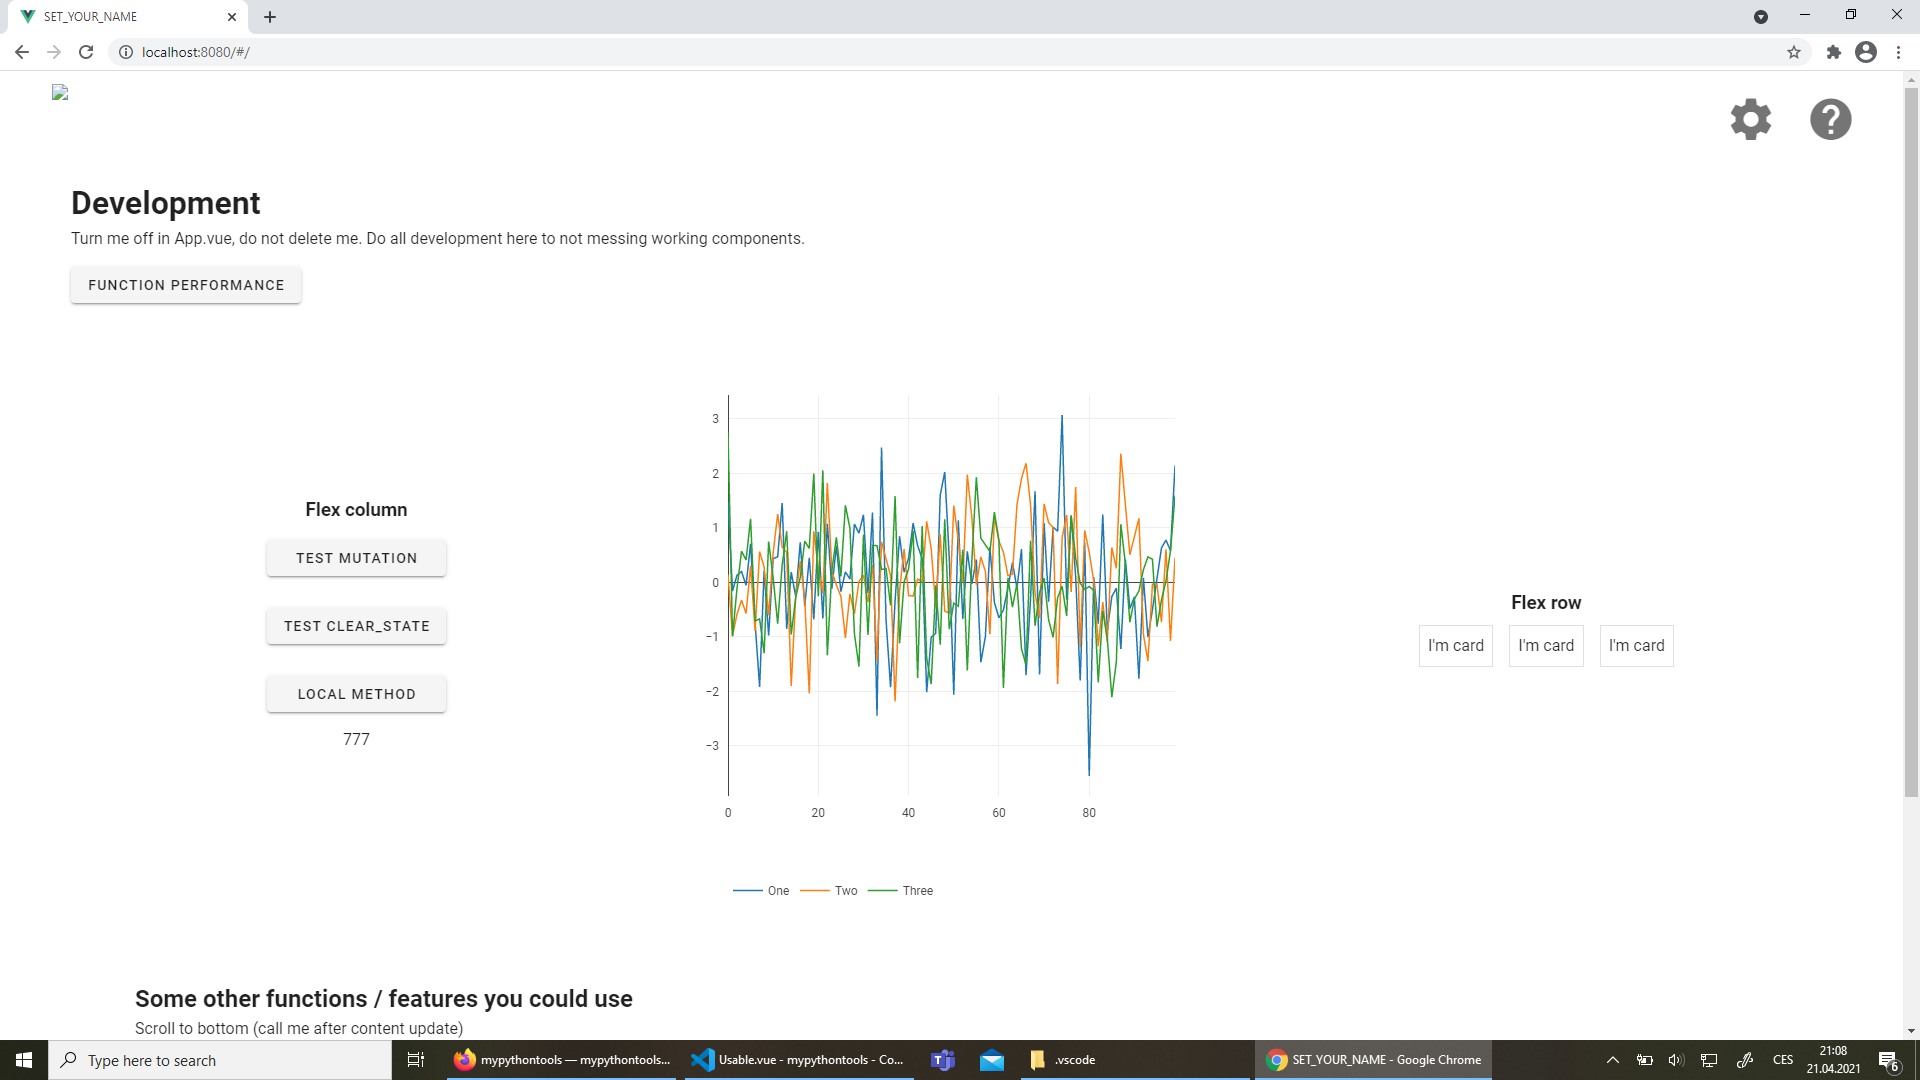
Printscreen
Links
Official documentation - https://pyvueeel.readthedocs.io/
Official repo - https://github.com/Malachov/pyvueeel
Installation
Python >=3.6 (Python 2 is not supported).
Install with:
pip install pyvueeel
Tutorial
Here you can find how to implement Py/Vue/Eel application from scratch.
- pyvueeel.expose(callback_function: Callable) None[source]
Wrap eel expose with try catch block and adding exception callback function.
Used for example for printing error to the frontend.
- Parameters
callback_function (Callable) – Function that will be called if exposed function fails on some error.
- pyvueeel.json_to_py(json: dict, replace_comma_decimal: bool = True, replace_true_false: bool = True) Any[source]
Take json and eval it from strings. If string to string, if float to float, if object then to dict.
When to use? - If sending object as parameter in function.
- Parameters
json (dict) – JSON with various formats as string.
replace_comma_decimal (bool, optional) – Some countries use comma as decimal separator (e.g. 12,3). If True, comma replaced with dot (Only if there are no brackets (list, dict…) and if not converted to number string remain untouched) . For example ‘2,6’ convert to 2.6. Defaults to True
replace_true_false (bool, optional) – If string is ‘false’ or ‘true’ (for example from javascript), it will be capitalized first for correct type conversion. Defaults to True
- Returns
Python dictionary with correct types.
- Return type
dict
Example
>>> # Can be beneficial for example when communicating with JavaScript
>>> json_to_py({'one_two': '1,2'})
{'one_two': 1.2}
- pyvueeel.run_gui(devel: bool | None = None, log_file_path: PathLike | None = None, is_multiprocessing: bool = False, build_gui_path: Literal['default'] | PathLike = 'default') None[source]
Function that init and run eel project.
It will autosetup chrome mode (if installed chrome or chromium, open separate window with no url bar, no bookmarks etc…) if chrome is not installed, it open microsoft Edge (by default on windows).
In devel mode, app is connected on live vue server. Serve your web application with node, debug python app file that calls this function (do not run, just debug - server could stay running after close and occupy used port). Open browser on 8080.
Debugger should correctly stop at breakpoints if frontend run some python function.
Note
Check project-starter on github for working examples and tutorial how to run.
- Parameters
devel (bool | None, optional) – If None, detected. Can be overwritten. Devel 0 run static assets, 1 run Vue server on localhost. Defaults to None.
log_file_path (PathLike | None), optional) – If not exist, it will create, if exist, it will append, if None, log to relative log.log and only if in production mode. Defaults to None.
is_multiprocessing (bool, optional) – If using multiprocessing in some library, set up to True. Defaults to False.
build_gui_path (PathLike), optional) – Where the web asset is. Only if debug is 0 but not run with pyinstaller. If None, it’s automatically find (but is slower then). If ‘default’, path from project-starter is used - ‘gui/web_builded’ is used. Defaults to ‘default’.
If you want to understand this technology more into detail, check this tutorial
https://pyvueeel.readthedocs.io/tools/pyvueeel-tutorial.html
- pyvueeel.to_table(df: pd.DataFrame, index: bool = False) dict[source]
Takes data (dataframe or numpy array) and transforms it to form, that vue-plotly library understands.
- Parameters
df (pd.DataFrame) – Data.
index (bool, optional) – Whether use index as first column (or not at all).
- Returns
Data in form for creating table in Vuetify v-data-table.
- Return type
dict
Example
>>> import pandas as pd
>>> df = pd.DataFrame([[1, "a"], [2, "b"]], columns=["numbers", "letters"])
>>> to_table(df)
{'table': [{'numbers': 1, 'letters': 'a'}, {'numbers': 2, 'letters': 'b'}], 'headers': [{'text': 'numbers', 'value': 'numbers', 'sortable': True}, {'text': 'letters', 'value': 'letters', 'sortable': True}]}
- pyvueeel.to_vue_plotly(data: np.ndarray | pd.DataFrame, names: list = None) dict[source]
Takes data (dataframe or numpy array) and transforms it to form, that vue-plotly understand.
Links to vue-plotly:
https://www.npmjs.com/package/vue-plotly https://www.npmjs.com/package/@rleys/vue-plotly - fork for vue 3 version
Note
In js, you still need to edit the function, it’s because no need to have all x axis for every column. Download the js function from project-starter and check for example.
- Parameters
data (np.array | pd.DataFrame) – Plotted data.
names (list, optional) – If using array, you can define names. If using pandas, columns are automatically used. Defaults to None.
- Returns
Data in form for plotting in frontend.
- Return type
dict
Example
>>> import pandas as pd
>>> df = pd.DataFrame([[1, "a"], [2, "b"]], columns=["numbers", "letters"])
>>> to_vue_plotly(df)
{'x_axis': [0, 1], 'y_axis': [[1, 2]], 'names': ['numbers']}
